How To Analyze Viewer Retention
Viewer retention is about understanding how long people stay engaged with your videos and why they stop watching. Here's what you need to know:
-
Key Metrics:
- View Time: Average percentage of a video watched (e.g., 60% of a 10-minute video means 6 minutes watched).
- Watch Time: Total hours people spend watching your videos - important for YouTube rankings.
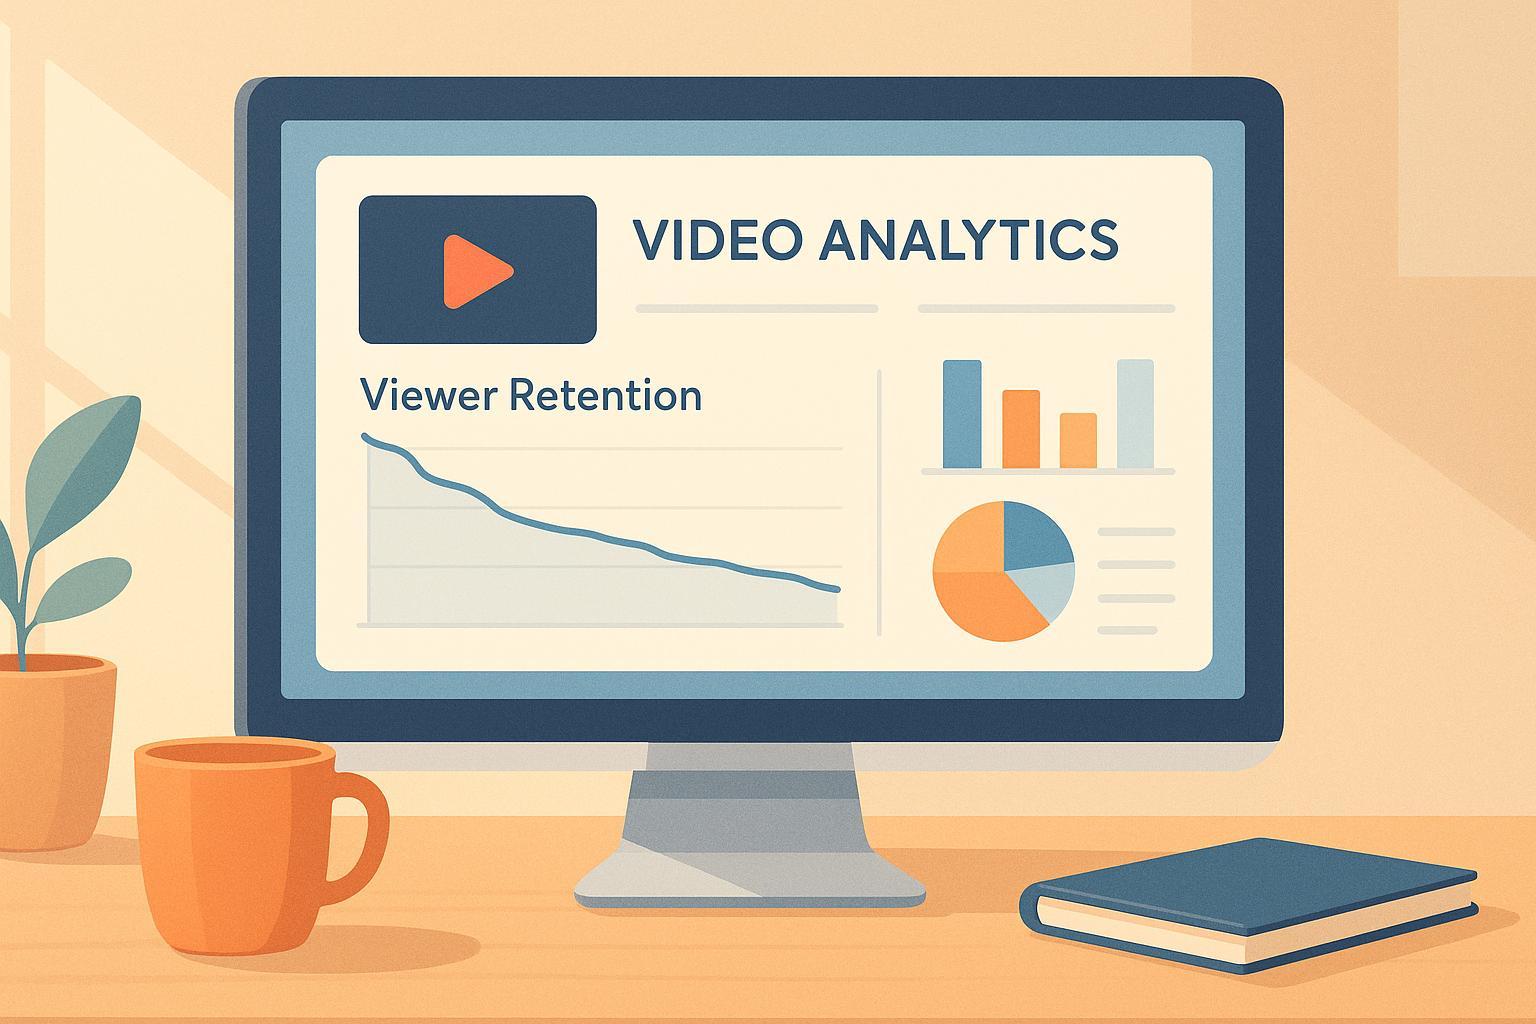
- Retention Graphs: Visualize where viewers drop off, rewatch, or stay engaged.
-
How to Use YouTube Analytics:
- Go to YouTube Studio > Analytics > Engagement > Audience Retention.
- Compare your video's performance (blue line) to your channel average (gray area).
- Look for patterns like steep drops, valleys, or spikes to identify areas for improvement.
-
Tips to Improve Retention:
- Start with a strong hook in the first 8 seconds.
- Use clear segments, visual changes, and a compelling call-to-action.
- Analyze drop-offs and replays to refine your content.
-
AI Tools:
- Platforms like LongStories.ai can help you create, test, and optimize videos quickly by generating scripts, visuals, and multiple video versions.
Retention analysis helps you make better videos by identifying what works and what doesn't. Use these insights to keep viewers engaged and grow your channel.
Core Viewer Retention Metrics
What is Viewer Retention?
Viewer retention measures the percentage of a video that viewers watch before clicking away. It's a key indicator of how engaging your content is and directly impacts success on YouTube. A higher retention rate means your video keeps viewers engaged, which can lead to better rankings, more appearances in recommendations, greater channel growth, and stronger audience interaction.
3 Key Metrics: View Time, Watch Time, and Retention Graphs
These three metrics help you assess your content's performance and make informed adjustments:
View Time tracks how long, on average, viewers watch your video. For example, if viewers watch 6 minutes of a 10-minute video, your view time is 60%.
Watch Time adds up the total time viewers spend watching your videos. This combines video length with the number of views, and it's a key factor in YouTube's ranking algorithm - more watch hours often mean better visibility.
Retention Graphs visually display viewer behavior throughout your video. They reveal:
- Points where viewers stop watching
- Moments that grab the most attention
- Sections that might need improvement
- Patterns in overall engagement
Here's how these metrics work together:
| Metric | What It Measures | Why It Matters |
|---|---|---|
| View Time | Average watch duration | Reflects how engaging the content is |
| Watch Time | Total viewing hours | Impacts YouTube's ranking system |
| Retention Graph | Viewer behavior over time | Pinpoints areas needing improvement |
For creators using tools like LongStories.ai, which enables videos up to 10 minutes in length (with extended formats on the way), these metrics highlight the importance of keeping viewers engaged throughout long-form video.
Next, dive into YouTube Analytics to see these metrics in action and identify ways to optimize your content.
Using YouTube Analytics
Finding the Retention Report
To access your retention data, log into YouTube Studio, head to Analytics > Engagement, and scroll down to Audience Retention. For more detailed insights, you can select a specific video or click on See more to view overall channel trends. Keep in mind, retention data becomes available 72 hours after a video is uploaded.
Reading the Retention Graph
The retention graph provides two key elements: a blue line that represents your video's retention and a gray area that shows your channel's average retention. The X-axis tracks time (mm:ss), while the Y-axis shows the percentage of viewers still watching.
| Graph Feature | Metric Details | Why It Matters |
|---|---|---|
| Blue Performance Line | Retention for the current video | Tracks how engaged viewers are throughout the video |
| Gray Benchmark Area | Channel average retention | Helps compare individual video performance |
| Percentage Scale | Viewers remaining (0–100%) | Shows how well your video holds audience attention |
| Timeline | Video duration | Identifies specific moments where viewers drop off |
"Videos outperforming channel averages by 15%+ typically get 2.3x more algorithmic promotion".
Understanding Graph Patterns
Retention graphs reveal patterns that can help you understand viewer behavior:
- Initial Drop: A steep drop in the first 15 seconds (losing 20% or more viewers) suggests your opening isn't engaging enough. For example, Red Bull's 2023 campaign videos maintained 97% retention at the 15-second mark - a 22% improvement over their channel's average.
- Mid-Video Valley: A dip between the 40–60% mark often indicates pacing issues. Many creators address this by adding pattern breaks to regain viewer attention.
- End Spikes: Peaks near the end of the video typically result from strong calls-to-action. Data shows that 78% of top educational channels consistently create these end spikes.
If retention falls below 85% at the 8-second mark, it's time to rethink your hook. Regularly reviewing your retention data is key - creators who analyze this data at least three times a month report 19% higher retention rates.
Reading Viewer Behavior Data
Spotting Drop-offs and Replays
Understanding where viewers drop off or replay can shed light on how your video is performing. Pay attention to these patterns:
| Behavior Pattern | What It Indicates | Recommended Action |
|---|---|---|
| Sudden Drops | A sharp decline in viewers at a specific point | Rework the opening or make the introduction more engaging |
| Gradual Decline | Steady loss of viewers throughout the video | Improve pacing and ensure transitions are smoother |
| Replay Spikes | Viewers repeatedly watching certain sections | Expand or clarify the content that's drawing attention |
| Early Exits | Viewers leaving before the video ends | Strengthen the closing message and refine the overall flow |
If you notice frequent replays, like viewers revisiting certain tutorial sections, it could signal areas worth expanding or emphasizing further.
Common Viewer Actions
Beyond drop-offs and replays, keeping an eye on typical viewer actions helps refine your content strategy. Here are two key behaviors to watch:
- Skip-Forward Patterns: When viewers skip ahead in clusters, it often means those sections aren't holding their attention. Consider restructuring or improving the delivery in those areas.
- Rewind Behaviors: Rewinds often highlight valuable content or moments that need clearer explanations. Take a closer look at these sections to ensure complex ideas are easy to follow.
Methods to Keep Viewers Watching
Better Video Structure and Timing
To keep your audience engaged, consider these tips:
- Begin with a strong hook to grab attention right away.
- Break your video into clear and organized segments for better flow.
- Add periodic visual or audio changes (known as pattern interrupts) to maintain interest.
- Wrap up with a clear call-to-action so viewers know what to do next.
Using Data to Improve Videos
Once your video is structured, use viewer data to fine-tune its performance. Here's how to make the most of retention analytics:
1. Spot Peak Engagement Moments
Find the moments where engagement is highest and use them strategically:
- Create standalone videos from these segments to expand your content library.
- Place similar engaging content earlier in new videos to hook viewers faster.
- Use these successful segments as inspiration for future projects.
2. Analyze Drop-Off Points
Look for patterns where viewers stop watching:
- If viewers leave early, strengthen your introduction to capture interest faster.
- For mid-video drop-offs, add more engaging elements to hold attention.
- When late exits occur, preview key benefits earlier to keep viewers invested.
3. Test with AI Tools
Experiment with AI-powered tools like LongStories.ai to:
- Generate multiple versions of your video.
- Test different visual styles and formats.
- Identify what resonates most with your audience.
sbb-itb-94859ad
AI Tools for Retention and Content
LongStories.ai Video Creation Tools
LongStories.ai simplifies video production, reducing the process from over 10 hours to just 5 minutes. This time-saving approach lets creators focus on improving viewer retention metrics instead of technical tasks.
The platform includes features designed to boost retention:
- Automated Script Generation: Creates engaging scripts to keep viewers hooked.
- Consistent Visual Styling: Ensures brand consistency by allowing easy editing and regeneration of visuals.
- Direct YouTube Publishing: Enables one-click uploads to YouTube, helping maintain a regular posting schedule to retain your audience.
Testing Videos with AI
Using LongStories.ai, creators can quickly test and refine their videos. The platform's AI tools make it easy to experiment with different elements to see what works best for keeping viewers engaged.
-
Rapid Video Variations
Generate multiple content versions to test various strategies:- Try different script structures.
- Experiment with visual styles and transitions.
- Adjust pacing and timing.
- Compare performance data across versions.
-
Performance Analysis
Track key metrics to evaluate each video's effectiveness:Metric Type What to Monitor Why It Matters Engagement Watch time patterns Highlights which content structures perform best. Retention Drop-off points Pinpoints where viewers lose interest. Response Click-through rates Evaluates the success of calls-to-action.
These insights lay the foundation for creating efficient AI-driven workflows.
Building AI Video Workflows
LongStories.ai's automated workflows help ensure consistent quality and audience engagement by:
- Setting clear content guidelines and brand parameters.
- Developing custom AI agents tailored to specific niches.
- Scheduling content weeks in advance.
- Maintaining high-quality standards across multiple videos.
The Pro Storyteller plan, available for $59/month, supports videos up to 10 minutes long - perfect for optimizing viewer retention. To see how this compares to how platforms pay creators on short-form, it's worth understanding why longer content unlocks more stable monetization.
"LongStories.ai automates the whole process so that in the time you could have created 1 video you have hundreds of them, and you can pick and choose which one you like the most", says Uri Riera, founder of LongStories.ai.
YouTube Audience Retention Explained With Tips
Conclusion
Effective retention analysis plays a key role in boosting video performance.
Understanding how viewers engage with your content helps you create videos that truly connect with your audience. By focusing on metrics like watch time and retention graphs, you can make informed decisions to improve your content's impact.
Tools like YouTube Analytics and AI-powered platforms have changed the game for creators. YouTube Analytics pinpoints where viewers drop off and reveals audience behavior patterns, while platforms like LongStories.ai help you act on these insights quickly with automated video creation.
Here are a few steps to help you enhance viewer engagement:
- Analyze retention graphs to spot drop-off points
- Use audience behavior data to refine your video structure
- Experiment with AI tools to test and improve your content
- Maintain a consistent posting schedule to build viewer habits
"LongStories is not another AI video generator. Create original stories that people actually want to watch"
- LongStories.ai
These tools and strategies allow creators to spend less time on repetitive tasks and more time refining their retention strategies. Combining YouTube Analytics with AI tools gives you a solid foundation for creating content that keeps viewers engaged.
Improving viewer retention is an ongoing process. With today's tools and metrics, it's easier than ever to analyze, test, and refine your approach - so you can focus on what matters most: creating content your audience loves.
FAQs
How can I use YouTube retention graphs to make better videos?
Retention graphs in YouTube Analytics are a powerful tool to help you understand how viewers engage with your videos. To use them effectively, start by identifying where viewer drop-offs occur. These are moments where many viewers stop watching, which could indicate areas to improve, such as pacing, content relevance, or production quality.
Pay attention to spikes in the graph as well - these show parts of your video that viewers rewatched or found particularly engaging. Use this insight to replicate successful elements in future videos. By regularly analyzing retention graphs, you can create more compelling content that keeps your audience engaged from start to finish.
What are common viewer retention trends, and how can I improve them?
Viewer retention data often reveals patterns that can help you understand audience behavior. Some common trends include:
- Sharp drop-offs early in the video: This usually indicates that the introduction isn't engaging enough or doesn't match viewer expectations. Start with a strong hook and clearly outline what the video will cover.
- Gradual declines: A steady drop-off throughout the video might suggest that the content isn't holding attention. Consider breaking up longer segments with visuals, storytelling, or interactive elements to keep viewers engaged.
- Spikes in retention: These occur when viewers rewind or rewatch specific parts of a video. Use these insights to identify what resonates most with your audience and replicate similar content in future videos.
To improve retention, focus on delivering value quickly, maintaining a clear and engaging narrative, and experimenting with different formats to see what works best for your audience.
How can AI tools like LongStories.ai help improve my video content and viewer retention?
AI tools like LongStories.ai streamline the video creation process by automating tasks, so you can focus on creating compelling stories. By simplifying workflows, the platform helps you produce high-quality, engaging videos tailored for platforms like YouTube and TikTok.
With features like creative control, optimized titles and descriptions, and the ability to directly publish content, LongStories.ai makes it easier to captivate your audience. Engaging, well-crafted videos are key to improving viewer retention, and this tool is designed to help you achieve that effortlessly.
Related posts
LongStories is constantly evolving as it finds its product-market fit. Features, pricing, and offerings are continuously being refined and updated. The information in this blog post reflects our understanding at the time of writing. Please always check LongStories.ai for the latest information about our products, features, and pricing, or contact us directly for the most current details.